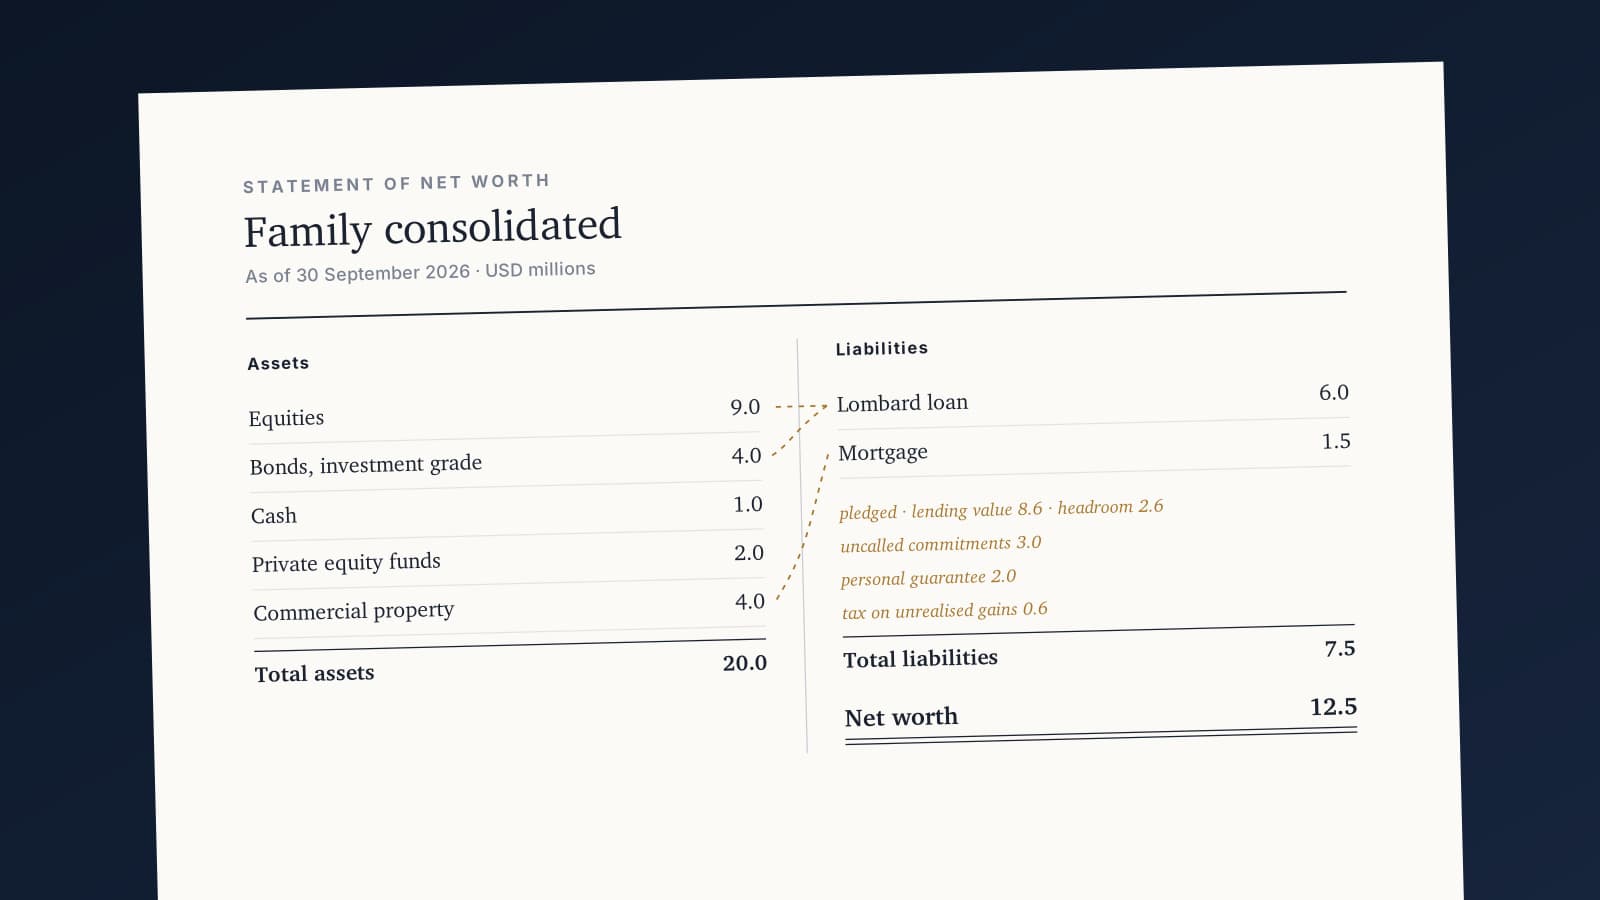
A premise nobody writes down
Every wealth management system rests on a sentence so obvious it has never been stated: a position is a thing that has a market value.
Buy a share, it is worth something. Add it all up and you have net worth. Divide the result by net worth and you have return. Multiply net worth by the fee rate and you have revenue. Four operations, and they carry the client report, the performance calculation, the risk controls and the invoice.
The premise held for decades because it was true. In a long, funded, custodied portfolio, the market value of a position and the client's economic exposure are the same number. There was no reason to separate them, and nobody did.
Synthetic exposure separates them. And once they come apart, the four operations keep running, keep adding up, keep producing reports — about the wrong thing.
The separation comes from five traits of the instrument, which hold for CFDs, total return swaps and their equivalents:
- They are unfunded. What leaves cash is margin.
- The exposure lives in the notional.
- Carry accrues daily, from the day after the trade until the position closes.
- Dividends become cash adjustments.
- Fair value is zero only on day one; after that it is the accumulated result, marked daily.
A client who owns no equities
A family with $10 million. Nothing exotic: $6 million in Treasuries, $2.8 million in a corporate credit ETF, $1.2 million in cash. The committee forms a view on semiconductors and wants to express it without dismantling the fixed income.
It moves the cash into a prime brokerage account and buys 25,000 shares of a semiconductor manufacturer via CFD at $200. Notional of $5 million, margin at 20%.
Three months later, with the stock at $216, the provider sends its usual statement:
| Field | Value |
|---|---|
| Instrument | NVDA |
| Side | Long |
| Quantity | 25,000 |
| Average price | 200.00 |
| Rate in force | SOFR 2.19% + 100bps |
| Exposure | $5,400,000 |
| Financing to date | −$39,875 |
| Margin held | $1,080,000 |
| Amount | |
|---|---|
| Deposit | $1,200,000 |
| Commission | −$2,500 |
| Financing | −$39,875 |
| Unrealised result | +$400,000 |
| Account equity | $1,557,625 |
| Margin required | $1,080,000 |
| Free margin | $477,625 |
It is all there. Exposure of $5.4 million, the rate in force, financing to date, margin held and — the number that decides whether the client can carry the position — $478 thousand of free margin. A fall of roughly 11% in the stock wipes that line out and triggers the call.
Now what the firm's system records:
| Item | Value |
|---|---|
| Treasury 2030 | $6,000,000 |
| Credit ETF | $2,800,000 |
| Margin account | $1,557,625 |
| Net worth | $10,357,625 |
One line. The statement arrived with eight fields and became a balance.
The accounting is impeccable: $1,557,625 is exactly what the client holds in that account. And the allocation report that comes out of it says 58% government, 27% credit, 15% derivatives and liquidity. Zero in equities.
Notice what was lost in the consolidation. The $5.4 million of exposure. The financing, which became a smaller balance with no explanation. The free margin, which is the only measure of fragility this operation has. And the fact that the portfolio's $1.2 million of cash no longer exists as cash — it is tied up, and without an external contribution or other eligible collateral, meeting a margin call means selling Treasuries or the ETF, probably at a loss, probably at the same moment the stock is falling.
Now the second table — the one that does not exist:
| Risk factor | Exposure | Comes from | Scenario | Impact |
|---|---|---|---|---|
| Interest rates | $6,000,000 | Treasury 2030 | +100 bp | −$228,000 |
| Credit spread | $2,800,000 | Credit ETF | +100 bp | −$112,000 |
| Equity — NVDA | $5,400,000 | NVDA CFD | −20% | −$1,080,000 |
And notice what it does not have: a total line. That is not an omission. Market values add up, because they are all in the same currency. Risk does not — the scenarios do not occur together or with the same frequency, and adding them would produce a number that describes nothing. Subtotal by factor, never a grand total.
What the table shows is that the equity line alone carries more risk in dollars than the two fixed income lines combined — and under the mildest of the three scenarios. Twenty per cent is a bad quarter for a semiconductor name, not a crisis; a hundred basis points on rates is a full-year event. (The scenarios are an editorial choice; the fixed income sensitivities are approximations that depend on coupon and prevailing rates.)
The exposure to a single stock amounts to more than half the client's net worth, and its name does not appear once in the first table. This is a modest, approvable trade that the firm's committee would wave through in an afternoon. Which is precisely why the example is uncomfortable: it is not a pathological case.
And here is what makes all of this awkward. None of these numbers had to be calculated. They arrived, finished, in the provider's statement, the morning after every session. Exposure, rate in force, financing, margin held, free margin. The data exists, it is daily, it is audited and it is sent.
It dies at the boundary of the portfolio system, which knows how to read exactly one field of that document: the balance.
The quarterly report will state, with every number correct, that this is a conservative fixed income portfolio.
But an appendix would do
The obvious answer is an explanatory section in the report: a page reproducing the statement's logic, with exposure, rate and margin, so the client understands what is being carried.
It solves the presentation and nothing else. The appendix transcribes what the counterparty already sent — and if transcribing were enough, you could staple the statement to the back of the report and dispense with the platform.
What a platform exists to do is something else. Add synthetic exposure to physical holdings in the same issuer, across clients and across counterparties. Check a concentration limit without someone reading and comparing by hand. Separate the financing leg in attribution. Calculate a billing base. None of that operates on presentation: it operates on the data model, and an appended page is not a data model. Worse, it creates a signed contradiction — page three says $5.4 million in NVDA, page one says zero in equities, and both came from the same firm.
What survives and what disappears
Most firms open a dedicated line for this — derivative results — rather than leaving the balance in cash and equivalents. That solves the easy part of the problem: the result has a line, and the line is honest about what it is.
Two things remain outside, and neither is fixed by classification.
The exposure appears under no line at all. It is not a matter of sitting in the wrong place. It is that $5.4 million of NVDA risk is not a value, and the entire chart of accounts is made of values. There is no account for "the client loses $54 thousand if the stock falls 1%", because that is not a balance of anything. It is the current exposure that produces future balances — and it has nowhere to live.
And the pledged capital is classified as something it is not. Of the $1.56 million in the account, $1.08 million is locked as margin for as long as the position exists. It is not invested, in the sense of producing a return of its own. It is not free, in the sense of being mobilisable. The allocation counts it as though it were — which is why the portfolio shows 15% in liquidity when real liquidity is $478 thousand, a number that exists only in the provider's statement.
The free margin itself disappears too, and it is the only measure of fragility the operation has. It does not vanish through misclassification. It vanishes because a chart of accounts has nowhere to hold a measure that is not a balance.
The cost with no column
Note that none of this is a calculation problem. The portfolio return is correct: on day one the denominator is the net worth supporting the margin, and from then on it is the NAV itself, which already absorbs the financing accrual and the position's result. No number needs fixing.
What is missing is knowing what it is a return on. And that shows up first in the cost.
Back to the example. Carrying $5 million of exposure for a year, at SOFR plus 100 bps, costs about $160 thousand. That is not expensive in absolute terms: financing the same exposure another way costs similar funding, and liquidating a position to reallocate costs tax. The right question was never whether the instrument is expensive. It is where that number shows up.
And it shows up nowhere.
It is not a management fee: it does not go to the firm. It is not a transaction cost: there is no transaction. It is not a price move: the price did not move because of it. With nowhere to put it, the system does what it knows — it drops it into the result.
What comes out in the report is that the position returned three percentage points less than the stock. An attribution that does not model financing assigns the difference to security selection. Whoever made the decision appears as the person who got the call wrong, when what happened was the cost of financing the exposure.
Do that three quarters in a row and the position is unwound. Not because it was wrong, but because what the measurement system cannot name, it charges to the manager.
The dividend that is not a dividend
The dividend adjustment is the same problem with an extra layer of disguise — because it looks a great deal like something the system already knows how to process.
It is not. The long side receives a contractual payment calculated by reference to the dividend. The corporate event exists in the underlying, but not in the client's position: he is not a shareholder, appears on no register, and what reaches him is a contract adjustment. A system that treats this as income will look for the corresponding event on the position and will not find it — and the calendars do not line up, because the physical holder follows the issuer's payment date while the contract adjusts around the ex-date, according to the counterparty's mechanics.
On the short side it is worse. The debit is triggered by a decision of a company the client does not follow, precisely because he is not a shareholder in it. It is a cash outflow generated by a third-party event that no portfolio calendar contains. A special dividend, which for a physical holder would be good news, becomes an unanticipated call.
And there is the effect that contaminates the whole report. The dividend adjustment is a component of the underlying's total return, replicated by contract. Classified as income, the portfolio reports a yield that does not exist — money coming from no asset held. Dropped into result, attribution loses the separation between what came from price and what came from dividends, and comparison against a total return index stops meaning anything.
Note that none of these is a defect of the instrument. They are all consequences of treating a contractual payment as though it were a corporate event — and the system does that because income is the only category it has for something that arrives periodically and is proportional to the position.
The fee with no base
Now the part that decides, because it is the part that shows up in revenue.
The firm charges 100 basis points on net worth. The client has $10.3 million. Revenue: $103 thousand. And it manages $5 million of exposure to a stock that does not appear in the billing base — the most consequential decision in the portfolio.
Someone will say, fairly, that this is no scandal. Same client, same mandate, and advisors do plenty that generates no marginal revenue. Nobody bills separately for rebalancing.
That is not the problem. The problem is that the relationship between what the firm manages and what it charges has stopped being stable, and the system has no way of knowing it.
Two cases make this undeniable.
The first is the standalone position at scale. A client who posts $2 million of margin to carry $10 million of directional exposure has $2 million of AUM and pays $20 thousand. The firm is answerable for $10 million of risk. The arithmetic is not unfair to anyone in particular — it is simply disconnected, and the disconnection grows with leverage.
The second is synthetic substitution, and it has no defence. The client holds $5 million of the stock physically. The firm concludes the exposure is more efficient synthetically — for access, for tax treatment, for balance sheet efficiency. It sells the physical, puts on $5 million of synthetic with $1 million of margin, and the client reallocates the $4 million released outside the mandate.
Client exposure: identical. Firm AUM: down $4 million. Revenue: down $40 thousand a year.
The firm loses revenue precisely for swapping market value for exposure — which is what the entire operation consisted of. There is no bad faith anywhere: the billing base reads market value, and market value is what left the portfolio.
There are three ways out, and each deserves an honest account of its flaw. Billing on exposure best preserves the link between billing base and economic responsibility — but it requires defining the metric per instrument, because gross notional is not risk: options need delta, dated contracts need tenor. And it requires a separate schedule and rate, well below the discretionary one. Billing on margin is mechanically trivial and perverse: the better the counterparty, the lower the margin, the lower the revenue. It is what happens by default when nobody decides anything. A flat mandate fee is defensible and transparent, but it breaks the alignment narrative and does not scale.
None is impossible. All are impossible in the system the firm already has — because the billing engine reads the position table, and the position table holds market value.
The covered case, where the system hides it better
The opposite case is the one that appears most often in presentations and reveals the least. A family with a concentrated position and a low tax basis sells notional synthetically: risk halves, ownership remains, nothing is realised, and the tax the sale would have triggered is deferred for years.
And here the system almost works. The shares are still there, net worth is intact, revenue is intact, and the portfolio return is correct.
Except that carry still has no line of its own, and attribution still blames the manager for a structural cost. And the exposure report is still blind: risk halved and no field in the system recorded it.
The best-managed portfolio in the office is the one that produces the most misleading report — and, in the covered case, the most convincing one, because net worth looks normal and the shares are right there.
Why it becomes "we don't do that here"
Put it together and watch a firm's decision process.
The committee likes the idea. Risk cannot measure the resulting exposure, because it exists in no field. Compliance looks at OTC derivative reporting obligations and finds the same hole from another angle: the firm would have to verify statements about a position its system does not represent. Compliance, correctly, says no.
Client relations asks how this appears in the client report. There is no good answer. Finance asks how much revenue it brings. Less than before.
And hanging over the table, the precedent everyone in the room knows: synthetic exposure built at scale, with none of the counterparties seeing the size of the whole, and without producing the ownership that would trigger certain disclosure obligations, and billions in bank losses when the position turned. It is an argument against hidden leverage, not against the instrument — but it ends the discussion every time anyone opens it.
And the gap that made it possible is still open: proposals for public reporting of large swap positions did not survive. The burden of knowing a portfolio's synthetic exposure falls entirely on the firm's own systems.
And notice what is lost there. A policy on the subject can be written in three lines — permitted to hedge concentration, prohibited for directional views, subject to a minimum liquidity buffer. Any committee approves it. But enforcing it requires distinguishing, inside the firm's own book, which of the two uses is happening, and auditing that month after month. Without exposure as a field, without carry as a line, without counterparty as a dimension, there is no way to verify the policy just written. The only enforceable rule about an instrument the system cannot see is a blanket ban.
What a fund does
A fund carrying swaps does not have this problem, and the way it solves it is instructive precisely because it is not sophisticated. Two documents with distinct jobs.
In the income statement, the derivative is a single line. Realised, unrealised and financing, all together. This is not sloppiness: established accounting practice treats it as inappropriate to split unrealised under one caption and cash settlement under another — net swap interest goes in the same line as the swap result. When the purpose is to determine result, consolidating is correct.
The document that carries the information is the other one. In the schedule of investments, each contract appears with counterparty, reference entity, financing rate, payment frequency, termination date, notional and unrealised appreciation — plus a footnote stating how much of the cash is held as collateral.
Whoever reads that page knows who the fund owes, what each contract costs, and what total exposure is against net assets — including when it is larger than they are.
Now compare it with the margin account in the example. That also consolidates — and in doing so it is right, for the same reason the fund consolidates. What is missing is the second document. The firm kept the accounting compression without the disclosure that makes it acceptable.
And nothing a fund discloses had to be calculated. Counterparty, notional, rate in force, collateral held and free margin arrive finished in the statement. Reproducing them by position is field mapping, not modelling.
That is the floor, and it is the floor the previous section said would not be enough. It is not enough: a table per portfolio still does not add synthetic to physical in the same issuer across clients, does not feed limits, does not enter attribution and does not become a billing base. But the distance between having nothing and having what a fund has published for decades is short, and almost nobody has covered it.
The answer is thirty years old
The embarrassing part is that none of this is an open problem. The methodology exists, is well known, and predates most of the platforms that have not implemented it.
The adaptation of the Brinson model to derivatives was described by Stannard in 1997, and afterwards by Menchero, by Bacon in 2008, by Fischer and Wermers, and by Bacon, Thompson and van der Westhuizen — all through the same mechanism: notional assets and notional returns. The derivative is decomposed into equivalent synthetic positions and attribution runs normally on top of them.
In the example, the contract becomes two lines:
| Line | Weight | Return |
|---|---|---|
| NVDA notional | +50% | stock return |
| Financing | −50% | cost of carry |
The two cancel in weight, the portfolio total closes back at 100%, the stock's contribution becomes its full return over its real weight, and carry falls on the financing leg — exactly where it belongs, without contaminating the equity return.
This is not a niche convention. It is the same treatment the prudential banking framework applies to market risk, decomposing a swap into two legs and representing financing as a short position in a security. And on the reporting side, managers running meaningful notional already publish portfolio composition on an exposure basis, with swaps entering at full notional and options delta-adjusted, because that is how the portfolio is actually run.
The second table in this article, then, is not an invention. It exists in audited documents, in prudential rules, and in performance literature going back nearly three decades.
Why it never arrived here
If the methodology is old and public, the question changes: why is it not in the system a multi-family office uses?
The answer is lineage.
Fund accounting solved this because it had no choice. It was born serving hedge funds, prime brokers and administrators — clients that are leveraged by definition, whose portfolios are made of swaps, shorts and financing. A system that could not represent that would have had no purpose. The complex case was the normal case.
Wealth management platforms were born from a different problem. Long, funded, custodied portfolios. And the complexity that surfaced first in that market was another kind: entity structure, trusts, holding companies, and above all alternative assets — capital calls, distributions, stale valuations, fund look-through. That is where decades of engineering went. Correctly, because that is where it hurt.
The result is that the capability exists in the industry, mature, and has for a long time. It is simply not where the family office needs it — and the family office is exactly who has, at once, the concentrated position, the tax problem and the counterparty access.
This is not a vendor failure. It is a consequence of which problem each category of software was born solving. What changed is that the private portfolio stopped being long, funded and custodied — and the architecture did not follow.
What a system would have to do
None of this is intractable. It is a data model, and a data model is a choice.
Two truths about the same instrument. The contract carries fair value simultaneously — feeding net worth, NAV and reconciliation — and notional or delta exposure, feeding allocation, risk, limits and billing. It is not one field with two readings. It is two fields, with an explicit, auditable rule about which feeds which report. And notional alone is not enough: dated instruments require tenor, optional ones require delta. Exposure is a structure, not a column.
Inverted look-through. Funds require look-through inwards, to the assets. Synthetics require look-through outwards, to the reference issuer. Without it, the firm-wide concentration report is fiction: two clients with the same risk appear on lines that never add up.
Carry as its own component in attribution. Not on the balance sheet — there, consolidating into one line is the correct treatment. But attribution that does not isolate carry is not measuring the manager: it is measuring the counterparty's spread.
Collateral as a state, not a class. Capital held as margin remains what it is, and gains a marker that it is committed and to which exposure. That is the only way to answer how much of the portfolio is immobilised supporting what — and what real liquidity is.
Exposure as a first-class billing base. With its own schedule and rate, able to coexist with the net worth base without mixing into it.
Counterparty as a dimension. Synthetic exposure does not sit at the custodian; it sits on someone's balance sheet. Netting, limits and concentration by counterparty, in the same way as asset class. And reconciliation against the statement of whoever holds the contract.
Six requirements. None exotic. All of them assumptions that a system built around "a position has a market value" does not satisfy by accident.
What actually happened
The low penetration of synthetic exposure in wealth management is usually explained as judgement: the industry looked at the instrument, weighed risk against benefit and chose prudence.
Perhaps. But the decision that actually constrains was made somewhere else, for another reason, and decades earlier — when someone defined a position as a line with a market value, and everything else was built on top of that line.
And this goes well beyond derivatives. The same premise that erases a synthetic contract from the risk report erases the economic exposure of an uncalled capital commitment, the rate risk of a lombard loan, and the leverage embedded in half the structured products already sitting in portfolios. These are not exceptions. They are what a private portfolio actually contains.
They all press on the same point: the market value of a position and the economic exposure of a client have stopped being the same thing.
The ledger is correct. It is simply not answering the question that matters.