Benchmarks have been the backbone of portfolio oversight for decades. They compress vast market complexity into a single number, allowing trustees, boards, and clients to understand performance at a glance. This shared language has enabled comparability across managers, created accountability, and imposed discipline on investment processes. The benchmark line has been both compass and scoreboard, and its influence can be seen in every quarterly review deck.
Yet history shows that this clarity sometimes hides important nuance. A portfolio may match its benchmark yet fail to generate sufficient liquidity to meet near-term obligations. During 2008 or March 2020, many investors watched their portfolios track the index perfectly while still facing uncomfortable spending cuts or capital calls. The benchmark provided context, but not comfort — it did not tell them if they were still solvent on their own terms.
Recognizing this tension does not mean abandoning benchmarks. They remain essential for situating results within the market environment. But these episodes suggest that a single line has never been enough to capture the full investor experience. Measurement gains depth when it adds a view of path, timing, and resilience alongside market-relative performance.
A well-known phenomenon in governance is that what gets measured gets managed. Benchmarks, by design, have encouraged portfolios to hug index weights to minimize tracking error. This has benefits: it deters style drift and ensures investors get the market exposures they expect. But the gravitational pull of the index can also lead to underinvestment in diversifiers, shrinking liquidity buffers, or avoiding contrarian positions that could improve long-term resilience.
Meeting minutes from investment committees often reveal that “explanation risk” — the need to justify deviations from the benchmark — can weigh more heavily than absolute risk. Tracking error becomes a proxy for comfort, even if the true risk lies elsewhere. This is not a flaw of the benchmark itself, but a natural consequence of elevating a single metric to centerpiece status. Over time, the metric stops being merely descriptive and starts to shape the very decisions it was meant to measure.
None of this implies that benchmarks are the wrong tool. They have brought rigor and comparability that were historically absent. The reflection here is whether governance can benefit from multiple reference points — using the benchmark as a market mirror but not the only lens through which success is judged.
Every investor has a unique context: cashflow needs, liabilities, tax regimes, and psychological thresholds for loss. The benchmark, by construction, represents an average market experience. It cannot reflect the fact that a foundation has fixed annual spending, or that a retiree depends on consistent withdrawals, or that a family office already carries large equity exposure via its operating business. These differences mean that even perfect index tracking can result in poor real-life outcomes.
Historical evidence from endowments and pensions shows that those who incorporated liability-driven metrics, funding ratios, or cashflow stress tests into their oversight were better able to weather downturns without forced sales. This reinforces the idea that complementary measures are not theoretical luxuries; they have been practical tools for institutions for decades.
The benchmark still has a place — it shows whether markets provided a tailwind or a headwind. But the lived experience of the investor has always been more complex. Asking, “Are we on track to fund our obligations?” is a different question than, “Did we beat the market?” and history suggests both questions deserve a place in the review room.
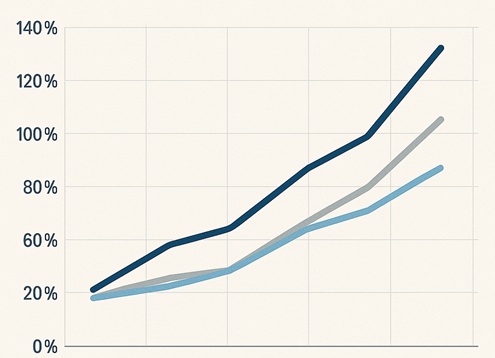
Practitioners have long used deterministic projections to show a path of expected wealth under stated assumptions. Plotting this as a corridor rather than a single line allows for natural variation and communicates that staying within the band still constitutes being “on plan.” This approach was common in actuarial reporting before it became popular in personal financial planning tools, and remains a powerful complement to benchmark-relative returns.
Illustrative data only. Normalized to 100 at start; corridor reflects a hypothetical goal path with uncertainty.
Unlike probabilistic Monte Carlo cones, which express a range of possible futures based on thousands of simulations, this corridor represents the single path implied by the plan with a tolerance band. It is a planning tool, not a prediction engine. Both can coexist: Monte Carlo highlights the distribution of possible outcomes, while the corridor offers a clear yardstick for current progress between review dates.
When benchmarks are placed alongside complementary views — such as goal corridors, cashflow projections, and risk guardrails — the dashboard itself becomes a decision tool. The conversation shifts from “did we beat the market?” to “what do these signals suggest we should do next?” This is not a call to abandon the index but to enrich it with layers that reflect the investor’s real objectives.
A well-designed panel shows the market context, the progress toward stated goals, and the current risk posture on a single page. Seeing these lenses together helps distinguish between noise and actionable drift: a portfolio might lag the index yet remain inside its goal corridor, requiring no intervention. Conversely, it may outperform the index but fall below a funding threshold, prompting a rebalance.
This integrated approach is where technology platforms — including Pivolt — have been advancing. By making multiple reference lines visible and dynamic, they enable decision-makers to interpret market moves in the context of their own plan rather than in isolation, turning measurement into navigation.
Benchmarks remain indispensable: they anchor discussions, standardize comparisons, and preserve discipline. The lesson from history is not that they should disappear, but that they work best in company. Cashflow projections, liability views, scenario stress tests — all are natural companions that enrich the picture of success.
This is where platforms like Pivolt are making a difference. By allowing multiple reference lines — market, objectives, risk guardrails — to coexist in a single interface, Pivolt helps investors see whether they are aligned with markets and with their own plans. The result is measurement that informs rather than dictates, giving boards and families the confidence to act with clarity even in volatile environments.
A broader view of success respects both the market’s story and the investor’s journey. Benchmarks still tell an essential part of the tale — but alongside their companions, they form a narrative that is richer, more resilient, and ultimately more useful for decision‑making.